Multiple Choice
Refer to the following chart showing a distribution of exporting firms: 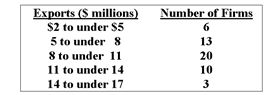
-How many firms export less than $14 million in product?
A) 3
B) 60
C) 50
D) 49
E) None of the choices are correct
Correct Answer:

Verified
Correct Answer:
Verified
Related Questions
Q13: The grades on a statistics exam for
Q15: Using the frequency table below, determine the
Q17: A table showing the number of observations
Q20: (i) Pie charts are useful for showing
Q21: Refer to the following distribution of commissions:
Q31: When data is collected using a qualitative,nominal
Q38: When a class interval is expressed as:
Q46: The following represent the ages of students
Q68: The relative frequency for a class is
Q87: How many employees were absent between 3