Multiple Choice
The chart below can be best described as 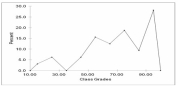
A) Line chart
B) Bar chart
C) Clustered bar chart
D) Stacked bar chart
E) Histogram
Correct Answer:

Verified
Correct Answer:
Verified
Related Questions
Q47: A row of a stem-and-leaf chart appears
Q60: (i) A frequency distribution is grouping of
Q61: Refer to the following ages (rounded to
Q62: Refer to the following ages (rounded to
Q63: Refer to the following chart showing a
Q64: (i) A frequency distribution is grouping of
Q67: A useful chart or graph to use
Q68: The monthly incomes of a small sample
Q69: The chart below can be best described
Q70: In a frequency distribution, what is the