Multiple Choice
The chart below can be best described as 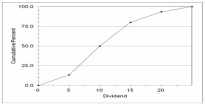
A) Line chart
B) Cumulative frequency polygon
C) Clustered bar chart
D) Stacked bar chart
E) Histogram
Correct Answer:

Verified
Correct Answer:
Verified
Related Questions
Q47: A row of a stem-and-leaf chart appears
Q64: (i) A frequency distribution is grouping of
Q65: The chart below can be best described
Q67: A useful chart or graph to use
Q68: The monthly incomes of a small sample
Q70: In a frequency distribution, what is the
Q71: Refer to the following price of jeans
Q72: Refer to the following distribution of commissions:
Q73: Quinn's Café serves ice cream. She asks
Q74: <img src="https://d2lvgg3v3hfg70.cloudfront.net/TB7521/.jpg" alt=" -Comparing the values