Multiple Choice
The figure shows the graphs of the cost and revenue functions for a company that manufactures and sells binoculars. Use the information in the figure to answer the question.
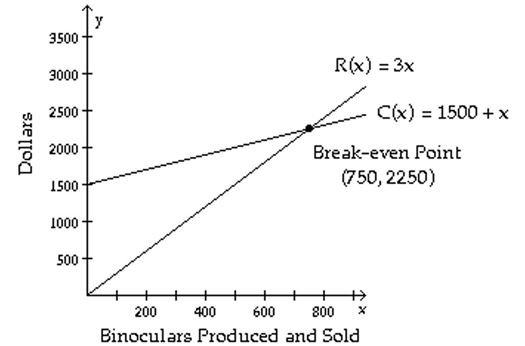
-Is there a profit when 956 binoculars are produced?
A) No
B) Yes
Correct Answer:

Verified
Correct Answer:
Verified
Related Questions
Q1: Write the partial fraction decomposition of
Q2: Solve the system by the addition
Q3: Write the partial fraction decomposition of
Q4: Solve the problem<br>-The sum of three
Q6: Solve the system by the substitution
Q7: Determine if the given ordered triple
Q8: Solve the problem<br>-Find the values of
Q9: Write the form of the partial
Q10: Solve the problem.<br>-A flat rectangular piece of
Q11: The figure shows the graphs of the