Multiple Choice
The line graph shows the recorded hourly temperatures in degrees Fahrenheit at an airport.
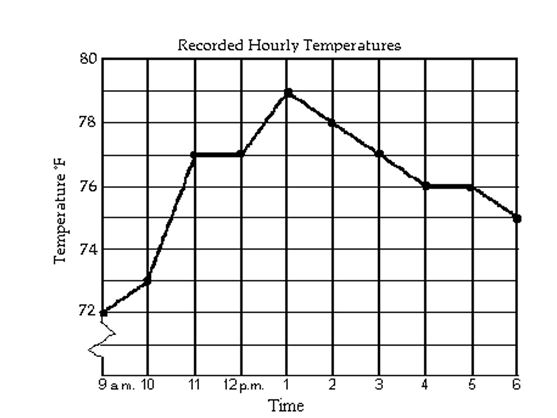
-During which two hour period did the temperature increase the most?
A) 10 a.m. to 12 p.m.
B) 12 p.m. to 2 p.m.
C) 9 a.m. to 11 a.m.
D) 10 a.m. to 11 a.m.
Correct Answer:

Verified
Correct Answer:
Verified
Q143: Solve the formula for the specified
Q144: Solve the equation using the quadratic
Q145: Solve the formula for the specified
Q146: Graph the equation.<br>-y = 4<br><img src="https://d2lvgg3v3hfg70.cloudfront.net/TB7043/.jpg" alt="Graph
Q147: Match the graph with its function
Q149: Match the story with the correct figure.<br>-The
Q150: Solve the problem.<br>-A car rental agency charges
Q151: Solve the absolute value inequality. Other
Q152: Perform the indicated operations and write
Q153: Find all values of x satisfying the