Essay
Construct an chart and determine whether the process variation is within statistical control.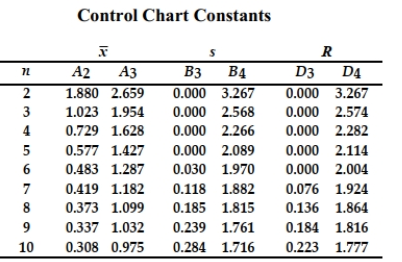
A machine that is supposed to fill small bottles to contain 20 milliliters yields the following data from a test of 4 bottles every hour.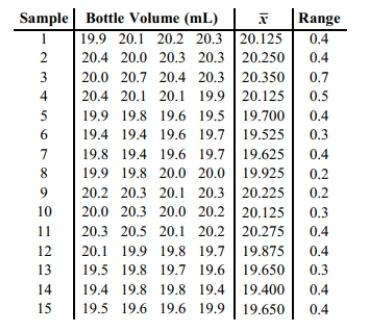
Correct Answer:

Verified
The process appears ...View Answer
Unlock this answer now
Get Access to more Verified Answers free of charge
Correct Answer:
Verified
The process appears ...
View Answer
Unlock this answer now
Get Access to more Verified Answers free of charge
Related Questions
Q12: Consider process data consisting of the
Q13: Describe an R chart and give an
Q14: Use the given process data to
Q15: A machine that is supposed to
Q16: A control chart for
Q18: A control chart for <span
Q19: _ measurement of a characteristic or good
Q20: A control chart for <span
Q21: Are control charts based on actual behavior
Q22: Use the given process data to