Multiple Choice
A machine that is supposed to fill small bottles to contain 20 milliliters yields the following data from a test of 4 bottles every hour. What would be the centerline for a control chart for ?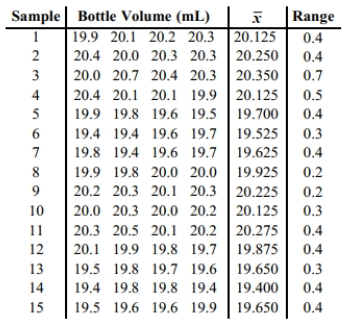
A) 0.380 milliliters
B) 19.935 milliliters
C) 20.000 milliliters
D) 20.212 milliliters
Correct Answer:

Verified
Correct Answer:
Verified
Related Questions
Q10: Which graph using individual data values
Q11: A control chart for <span
Q12: Consider process data consisting of the
Q13: Describe an R chart and give an
Q14: Use the given process data to
Q16: A control chart for
Q17: Construct an <span class="ql-formula" data-value="R"><span
Q18: A control chart for <span
Q19: _ measurement of a characteristic or good
Q20: A control chart for <span