Multiple Choice
A machine is supposed to fill boxes to a weight of 50 pounds. Every 30 minutes a sample of four boxes is tested; the results are given below. What would be the value of the centerline that would be used in creating an R chart? 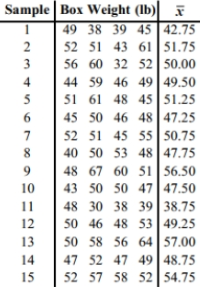
A) 49.567 pounds
B) 50 pounds
C) 11.00 pounds
D) 12.8000 pounds
Correct Answer:

Verified
Correct Answer:
Verified
Q22: Use the given process data to
Q23: Examine the given run chart or control
Q24: A _ is a sequential plot of
Q25: Control charts are used to monitor changing
Q28: Examine the given run chart or control
Q29: Match the chart with its characteristic.<br> <img
Q30: Construct an <span class="ql-formula" data-value="R"><span
Q31: R charts are used to monitor_.<br>A) means<br>B)
Q32: Define statistically stable (or "within statistical control").
Q32: Define statistically stable (or "within statistical control").