Essay
Construct an chart and determine whether the process variation is within statistical control.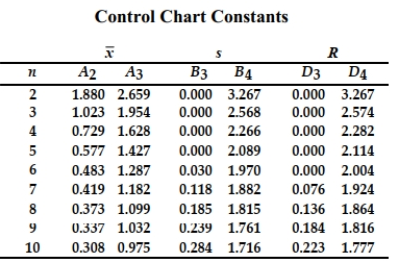
A machine that is supposed to produce ball bearings with a diameter of 7 millimeters yields the following data from a test of 5 ball bearings every 20 minutes.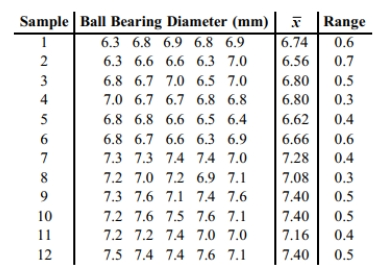
Correct Answer:

Verified
The process appears ...View Answer
Unlock this answer now
Get Access to more Verified Answers free of charge
Correct Answer:
Verified
View Answer
Unlock this answer now
Get Access to more Verified Answers free of charge
Q25: Control charts are used to monitor changing
Q27: A machine is supposed to fill boxes
Q28: Examine the given run chart or control
Q29: Match the chart with its characteristic.<br> <img
Q31: R charts are used to monitor_.<br>A) means<br>B)
Q32: Define statistically stable (or "within statistical control").
Q32: Define statistically stable (or "within statistical control").
Q33: Construct an <span class="ql-formula" data-value="R"><span
Q34: Examine the given run chart or control
Q35: Sketch a run chart that that indicates