Multiple Choice
A nurse measured the blood pressure of each person who visited her clinic. Following is a relative-frequency histogram for the systolic blood pressure readings for those people aged between 25 and 40 years. The blood pressure readings were given to the nearest
Whole number. Approximately what percentage of the people aged 25 -40 had a systolic
Blood pressure reading between 110 and 119 mm Hg inclusive? Systolic Blood Pressure for People Aged Years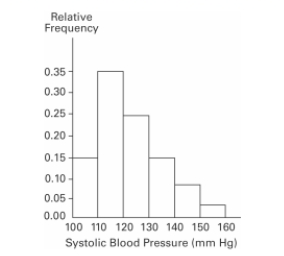
Systolic Blood Pressure (mm Hg)
A)
B)
C)
D)
Correct Answer:

Verified
Correct Answer:
Verified
Q1: Use the high closing values of
Q3: The following frequency distribution displays the
Q4: Describe the differences between a histogram and
Q5: The following data set represents Heather's
Q6: Suppose that a data set has a
Q7: The following frequency distribution analyzes the
Q8: According to USA Today, the largest categories
Q9: Which choice displays the best graphic
Q10: The frequency distribution below summarizes the
Q11: Which of the following cumulative frequency