Multiple Choice
The following data represent the number of cars passing through a toll booth during a certain time period over a number of days.
Which of these choices display the correct dotplot?
A) Number of Cars Passing Through
a Toll Booth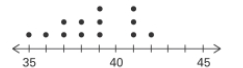
B) Number of Cars Passing Through
a Toll Booth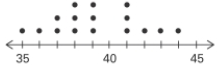
C) Number of Cars Passing Through
a Toll Booth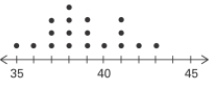
D) Number of Cars Passing Through
a Toll Booth 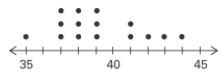
Correct Answer:

Verified
Correct Answer:
Verified
Q48: The frequency distribution below summarizes employee
Q49: The frequency distribution below summarizes the
Q50: Explain in your own words why a
Q51: Kevin asked some of his friends
Q52: Smoking and the episodes of lung cancer
Q54: The graph below shows the number of
Q55: A store manager counts the number
Q56: The attendance counts for this season's
Q57: Describe how a data point labeled as
Q58: The two key parts of a regression