Short Answer
The figure represents the results of a survey on favorite foods. 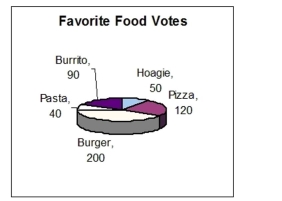 What percent of the votes were for burritos?
Correct Answer:

Verified
Correct Answer:
Verified
Related Questions
Q148: Multiply the fractions and simplify to lowest
Q149: A company did a poll of how
Q150: An inheritance of $20,223 is to be
Q151: Use a protractor to construct an angle
Q152: Add. Write the answer as a fraction
Q154: The price per gallon for regular unleaded
Q155: Write the percent equation. Then solve for
Q156: The figure represents the results of a
Q157: Write the percent equation. Then solve for
Q158: Find the area of the trapezoid. <img