Multiple Choice
The figure represents the results of a survey on favorite foods. 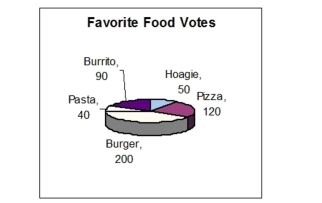 What percent of the votes were for pasta?
A) 5%
B) 8%
C) 6%
D) 7%
Correct Answer:

Verified
Correct Answer:
Verified
Related Questions
Q149: A company did a poll of how
Q151: Use a protractor to construct an angle
Q152: Add. Write the answer as a fraction
Q153: The figure represents the results of a
Q154: The price per gallon for regular unleaded
Q155: Write the percent equation. Then solve for
Q157: Write the percent equation. Then solve for
Q158: Find the area of the trapezoid. <img
Q159: Convert the units of length using unit
Q160: Darin plans to build a rectangular patio