Multiple Choice
Find the indicated z score. The graph depicts the standard normal distribution with mean 0 and standard deviation 1. Shaded area is 0.4483. 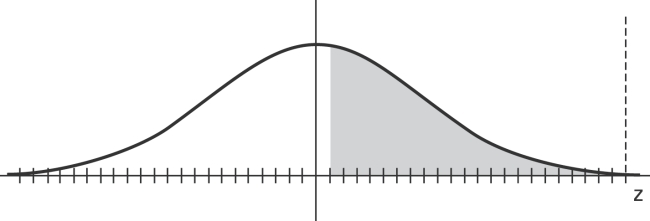
A) −0.13
B) 0.3264
C) 0.6736
D) 0.13
Correct Answer:

Verified
Correct Answer:
Verified
Related Questions
Q31: The distribution of certain test scores
Q32: If z is a standard normal variable,
Q33: A bank's loan officer rates applicants
Q34: For women aged 18-24, systolic blood pressures
Q37: A normal quartile plot is given below
Q39: Assume that the red blood cell counts
Q40: A bank's loan officer rates applicants for
Q41: An unbiased estimator is a statistic that
Q53: Identify three important criteria to determine if
Q54: For the binomial distribution with n=24