Essay
A normal quartile plot is given below for a sample of scores on an aptitude test. Use the
plot to assess the normality of scores on this test. Explain your reasoning. 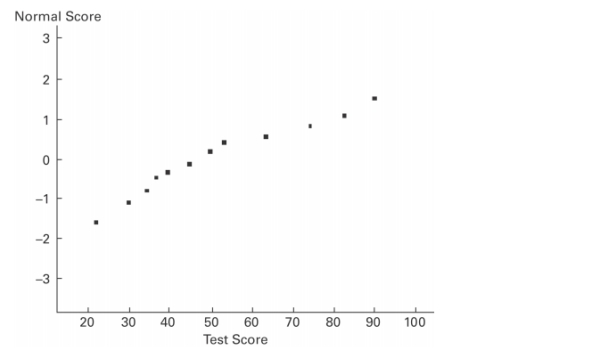
Correct Answer:

Verified
Since the normal quartile plot...View Answer
Unlock this answer now
Get Access to more Verified Answers free of charge
Correct Answer:
Verified
Since the normal quartile plot...
View Answer
Unlock this answer now
Get Access to more Verified Answers free of charge
Related Questions
Q32: If z is a standard normal variable,
Q33: A bank's loan officer rates applicants
Q34: For women aged 18-24, systolic blood pressures
Q36: Find the indicated z score. The graph
Q39: Assume that the red blood cell counts
Q40: A bank's loan officer rates applicants for
Q41: An unbiased estimator is a statistic that
Q42: If z is a standard
Q53: Identify three important criteria to determine if
Q54: For the binomial distribution with n=24