Multiple Choice
The following data represent the number of cars passing through a toll booth during a certain time period over a number of days.
Which of these choices display the correct dotplot?
A) Number of Cars Passing Througha Toll Booth 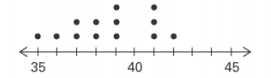
B) Number of Cars Passing Through a Toll Booth 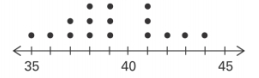
C) Number of Cars Passing Through a Toll Booth 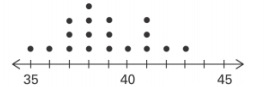
D) Number of Cars Passing Through a Toll Booth 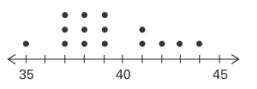
Correct Answer:

Verified
Correct Answer:
Verified
Q31: The linear _ coefficient denoted by r
Q38: The following data show the number
Q39: The graph below shows the number of
Q41: The weights (in pounds)of 22 members
Q42: The scatterplot below displays the amount of
Q44: Analysis of the data from 25
Q45: Identify the cumulative frequency distribution that
Q46: A store manager counts the number
Q47: A nurse measured the blood pressure
Q48: The following frequency distribution depicts the