Multiple Choice
The scatterplot below displays the amount of nitrous oxide (NO) explained by the amount of_ carbon monoxide (CO) emissions in million metric tons over a ten year period in the United
States. Select the choice that best describes any relationship between the variables. 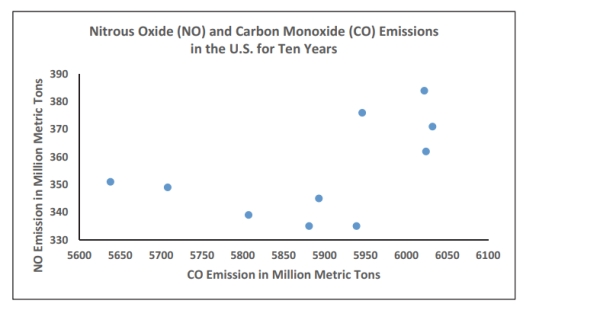
A) There is a negative linear association between NO and CO.
B) There is a positive linear association between NO and CO.
C) Overall, there is no noticeable relationship between NO and CO.
D) NO can be explained by CO.
Correct Answer:

Verified
Correct Answer:
Verified
Q31: The linear _ coefficient denoted by r
Q37: A manufacturer records the number of
Q38: The following data show the number
Q39: The graph below shows the number of
Q41: The weights (in pounds)of 22 members
Q43: The following data represent the number
Q44: Analysis of the data from 25
Q45: Identify the cumulative frequency distribution that
Q46: A store manager counts the number
Q47: A nurse measured the blood pressure