Essay
The figure shows is a plot and a fitted linear regression line of the age-earnings profile of
1,744 individuals, taken from the Current Population Survey. 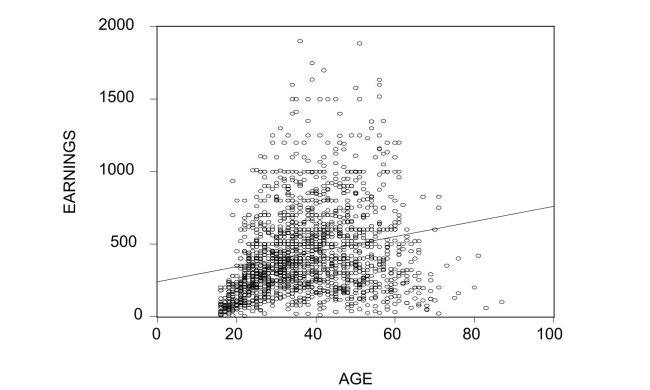 (a)Describe the problems in predicting earnings using the fitted line.What would the pattern
of the residuals look like for the age category under 40?
Correct Answer:

Verified
Answers will vary by students,...View Answer
Unlock this answer now
Get Access to more Verified Answers free of charge
Correct Answer:
Verified
View Answer
Unlock this answer now
Get Access to more Verified Answers free of charge
Q3: (Requires Calculus)Show that for the log-log model
Q19: In estimating the original relationship between
Q20: Earnings functions attempt to predict the
Q21: Sports economics typically looks at winning
Q22: Females, it is said, make 70 cents
Q25: Many countries that experience hyperinflation do
Q26: In nonlinear models, the expected change
Q27: In the model <span class="ql-formula"
Q44: Choose at least three different nonlinear functional
Q61: Assume that you had data for a