Multiple Choice
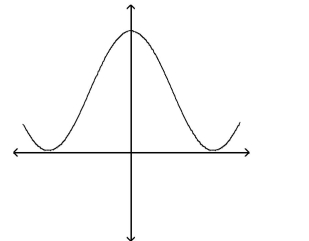
A) The graph cannot represent a normal density function because it increases as x becomes very large or very small.
B) The graph cannot represent a normal density function because it takes negative values for some values of x.
C) The graph cannot represent a normal density function because the area under the graph is greater than 1.
D) The graph can represent a normal density function.
Correct Answer:

Verified
Correct Answer:
Verified
Q2: Approximately _% of the area under the
Q4: For a standard normal curve, find the
Q5: Find the z-score for which the area
Q7: Determine whether the following normal probability plot
Q9: For the following conditions, determine if it
Q10: Find the area under the standard normal
Q11: Find the z-score for which the area
Q15: Find the area under the standard normal
Q31: Find the area under the standard normal
Q101: Find the z-scores for which 90% of