Multiple Choice
Determine whether the following normal probability plot indicates that the sample data could have come froma population that is normally distributed. 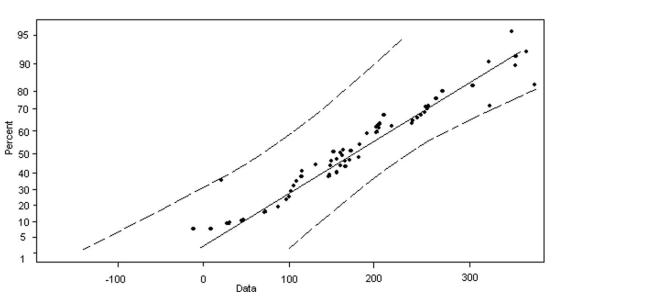
A) normally distributed
B) not normally distributed
Correct Answer:

Verified
Correct Answer:
Verified
Related Questions
Q2: Approximately _% of the area under the
Q3: <img src="https://d2lvgg3v3hfg70.cloudfront.net/TB6004/.jpg" alt=" A) The graph
Q4: For a standard normal curve, find the
Q5: Find the z-score for which the area
Q9: For the following conditions, determine if it
Q10: Find the area under the standard normal
Q11: Find the z-score for which the area
Q31: Find the area under the standard normal
Q71: Find the area under the standard normal
Q101: Find the z-scores for which 90% of