Multiple Choice
The bar graph below shows the political party affiliation of 1000 registered U.S. voters. What percentage of the1000 registered U.S. voters belonged to one of the traditional two parties (Democratic and Republican) ? 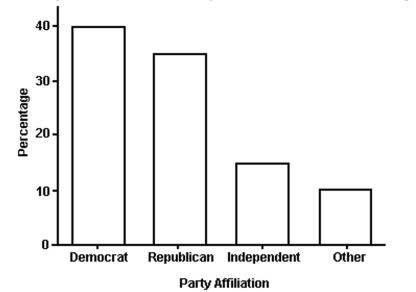
A) 75%
B) 40%
C) 35%
D) 25%
Correct Answer:

Verified
Correct Answer:
Verified
Q19: The following graph shows the number of
Q20: A random sample of 30 high
Q21: A researcher records the number of
Q22: A random sample of 30 high
Q23: <span class="ql-formula" data-value="\begin{array} { c | c
Q25: Student Council President <img src="https://d2lvgg3v3hfg70.cloudfront.net/TB6004/.jpg" alt="Student Council
Q26: The preschool children at Elmwood Elementary
Q27: Use the following frequency distribution to
Q28: The data set: ages of dishwashers
Q29: <img src="https://d2lvgg3v3hfg70.cloudfront.net/TB6004/.jpg" alt=" Is either histogram