Essay
The following graph shows the number of car accidents occurring in one city in each of the years 2006 through2011 (Year 1 = 2006, Year 2 = 2007 etc). The number of accidents dropped in 2008 after a new speed limit wasimposed. How is the bar graph misleading? How would you redesign the graph to be less misleading? 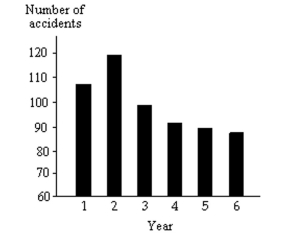
Correct Answer:

Verified
The bar graph is misleading because the ...View Answer
Unlock this answer now
Get Access to more Verified Answers free of charge
Correct Answer:
Verified
View Answer
Unlock this answer now
Get Access to more Verified Answers free of charge
Q14: The scores for an economics test
Q15: The payroll amounts for 26 major-league baseball
Q16: The local police, using radar, checked
Q17: The weights (in pounds) of babies
Q18: The data set: Pick Three Lottery
Q20: A random sample of 30 high
Q21: A researcher records the number of
Q22: A random sample of 30 high
Q23: <span class="ql-formula" data-value="\begin{array} { c | c
Q24: The bar graph below shows the political