Multiple Choice
The graph shows the monthly revenue in millions of dollars of a growing company after the company doubled its advertising. Use the graph to solve the problem. 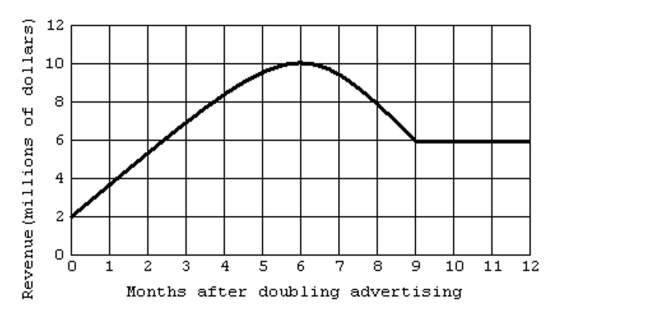
-During what period of time is the company's monthly revenue decreasing?
A) From the time that the advertising was doubled until the 9th month
B) From the time that the advertising was doubled until the 6th month
C) From the 9th month to the 12th month
D) From the 6th month to the 9th month
Correct Answer:

Verified
Correct Answer:
Verified
Q86: Find the y- and x-intercepts for
Q87: The graph shows the monthly revenue in
Q88: Provide an appropriate answer.<br>-Determine whether the points
Q89: Determine whether the lines through each pair
Q90: Indicate in which quadrant the point
Q92: Graph the equation.<br>-y + 3 = 0
Q93: Graph the linear equation in two
Q94: Graph the linear equation in two
Q95: Determine whether the lines through each pair
Q96: Graph the linear equation in two