Multiple Choice
The graph shows the monthly revenue in millions of dollars of a growing company after the company doubled its advertising. Use the graph to solve the problem. 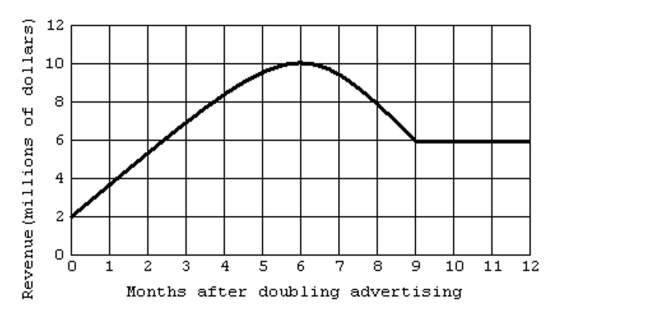
-Estimate the maximum revenue during the period of time plotted on the graph.
A) $7 million
B) $10 million
C) $9 million
D) $5 million
Correct Answer:

Verified
Correct Answer:
Verified
Q82: Plot the given point in a
Q83: Graph the linear equation in two variables.<br>-y
Q84: Find the y- and x-intercepts for
Q85: Find the slope of the line, or
Q86: Find the y- and x-intercepts for
Q88: Provide an appropriate answer.<br>-Determine whether the points
Q89: Determine whether the lines through each pair
Q90: Indicate in which quadrant the point
Q91: The graph shows the monthly revenue in
Q92: Graph the equation.<br>-y + 3 = 0