Multiple Choice
The bar graph below gives the number of births in a certain state for the months October to April, where corresponds to October and corresponds to April. If the number of births in thousands in this state is the function , where is in months, find and explain its meaning.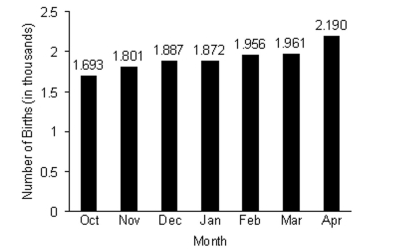
A) 1.887; In December, there were 1887 births in this state.
B) 1.872; In January, there were 1.872 births in this state.
C) 1.872; In January, there were 1872 births in this state.
D) 1.956; In February, there were 1956 births in this state.
Correct Answer:

Verified
Correct Answer:
Verified
Q247: State whether the graph is or is
Q248: Decide whether or not the equation
Q249: Determine whether the given relationship defines a
Q250: Graph the scatter plot of the
Q251: Graph the equation.<br>- <span class="ql-formula" data-value="25
Q253: Provide an appropriate response.<br>-Find an appropriate
Q254: The percent p of high school
Q255: <img src="https://d2lvgg3v3hfg70.cloudfront.net/TB6590/.jpg" alt="
Q256: Determine a viewing window that will
Q257: Find the domain and range for