Multiple Choice
Graph the scatter plot of the data.
- 
A) 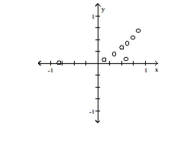
B) 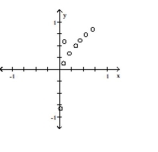
C) 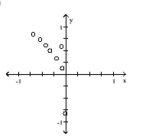
D) 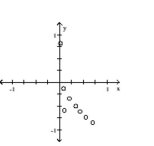
Correct Answer:

Verified
Correct Answer:
Verified
Related Questions
Q245: Provide an appropriate response.<br>- <span class="ql-formula"
Q246: <img src="https://d2lvgg3v3hfg70.cloudfront.net/TB6590/.jpg" alt=" If
Q247: State whether the graph is or is
Q248: Decide whether or not the equation
Q249: Determine whether the given relationship defines a
Q251: Graph the equation.<br>- <span class="ql-formula" data-value="25
Q252: The bar graph below gives the
Q253: Provide an appropriate response.<br>-Find an appropriate
Q254: The percent p of high school
Q255: <img src="https://d2lvgg3v3hfg70.cloudfront.net/TB6590/.jpg" alt="