Multiple Choice
The following graph shows the populations of the metropolitan areas of City X and City Y over six years. 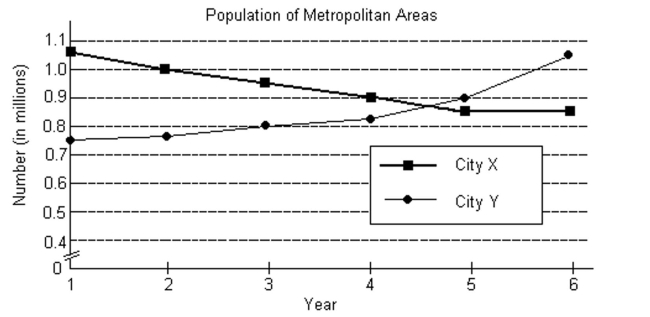
-In what years was the population of the City X metropolitan area less than that of the City Y metropolitan area?
A) Years 1-3
B) Years 1-5
C) Years 5-6
D) Years 3-5
Correct Answer:

Verified
Correct Answer:
Verified
Related Questions
Q288: Graph the solution set of the
Q289: Find the partial fraction decomposition for
Q290: Solve the problem.<br>-Carole's car averages
Q291: Solve the system by using the
Q292: A nonlinear system is given, along
Q294: Use the Gauss-Jordan method to solve
Q295: Which method should be used to
Q296: Find the matrix product when possible.<br>-
Q297: The graph shows the region of
Q298: Use the given row transformation to