Multiple Choice
The graph shows the region of feasible solutions. Find the maximum or minimum value, as specified, of the objective
function.
- 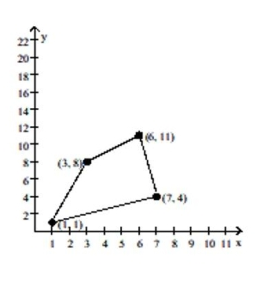
A) 13
B) 32
C) 50
D) 35
Correct Answer:

Verified
Correct Answer:
Verified
Related Questions
Q292: A nonlinear system is given, along
Q293: The following graph shows the populations of
Q294: Use the Gauss-Jordan method to solve
Q295: Which method should be used to
Q296: Find the matrix product when possible.<br>-
Q298: Use the given row transformation to
Q299: Evaluate the determinant.<br>- <span class="ql-formula" data-value="\left|
Q300: Use a graphing calculator to solve
Q301: Perform the operation or operations when
Q302: Provide an appropriate response.<br>-Suppose that you