Multiple Choice
The following graph shows the populations of the metropolitan areas of City X and City Y over six years. 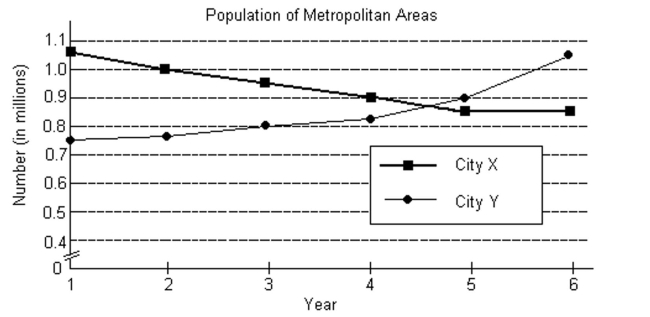
-At the time when the populations of the two metropolitan areas were equal, what was the approximate population of each area?
A) about 0.92 million
B) about 0.87 million
C) about 0.95 million
D) about 1.03 million
Correct Answer:

Verified
Correct Answer:
Verified
Q10: Solve the problem.<br>-A contractor mixes concrete
Q11: Solve the equation for x.<br>- <span
Q12: Find the value of the determinant.<br>-
Q13: Which method should be used to
Q14: Find the inverse, if it exists,
Q16: The following graph shows the populations of
Q17: Solve the system for x and
Q18: Graph the solution set of the
Q19: Determine the inequality which matches the
Q307: If the graphs of a system of