Multiple Choice
The following graph shows the populations of the metropolitan areas of City X and City Y over six years. 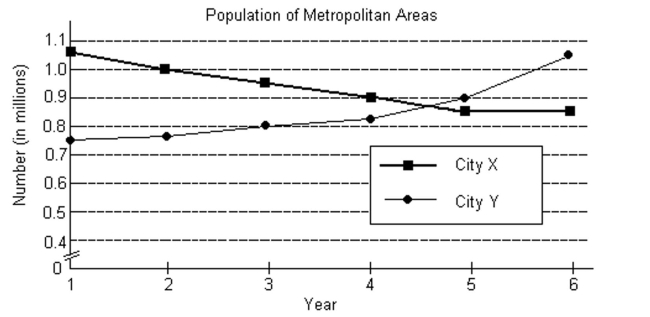
-Use the terms increasing, decreasing, and/or constant to describe the trends for the population of the City X metropolitan area.
A) The population of the City X metropolitan area was increasing from Year 1 to Year 5 and was constant from Year 5 to Year 6.
B) The population of the City X metropolitan area was decreasing from Year 1 to Year 6.
C) The population of the City X metropolitan area was increasing from Year 1 to Year 6.
D) The population of the City X metropolitan area was decreasing from Year 1 to Year 5 and was constant from Year 5 to Year 6.
Correct Answer:

Verified
Correct Answer:
Verified
Q11: Solve the equation for x.<br>- <span
Q12: Find the value of the determinant.<br>-
Q13: Which method should be used to
Q14: Find the inverse, if it exists,
Q15: The following graph shows the populations of
Q17: Solve the system for x and
Q18: Graph the solution set of the
Q19: Determine the inequality which matches the
Q21: Solve the problem.<br>-Michael's bank contains only nickels,
Q307: If the graphs of a system of