Multiple Choice
The line graph shows the recorded hourly temperatures in degrees Fahrenheit at an airport. 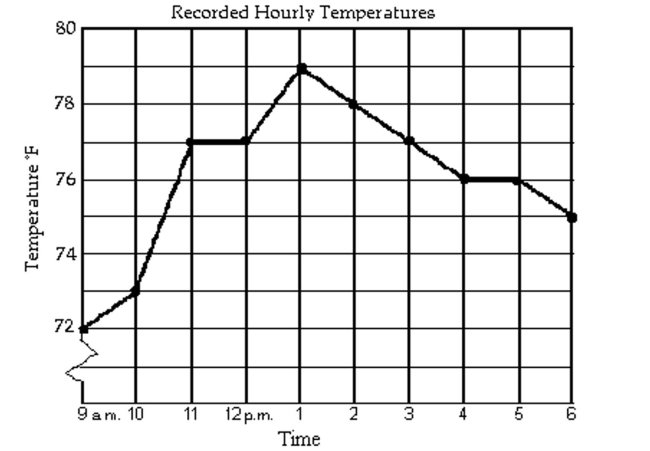
-During which hour did the temperature increase the most?
A) 1 p.m. to 2 p.m.
B) 12 p.m. to 1 p.m.
C) 10 a.m. to 11 a.m.
D) 9 a.m. to 10 a.m.
Correct Answer:

Verified
Correct Answer:
Verified
Related Questions
Q276: Determine whether the equation has a
Q277: Compute and simplify the difference quotient
Q278: Give the domain and range of
Q279: Determine whether the three points are collinear.<br>-(-2,
Q280: Graph the function.<br>-Suppose a life insurance policy
Q282: For the given functions f and
Q283: Describe how the graph of the
Q284: Find the average rate of change
Q285: Determine whether the three points are the
Q286: For the given functions f and