Multiple Choice
Find the average rate of change illustrated in the graph.
-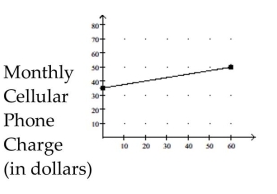
Usage (in minutes)
A) per minute
B) per minute
C) per minute
D) per minute
Correct Answer:

Verified
Correct Answer:
Verified
Related Questions
Q279: Determine whether the three points are collinear.<br>-(-2,
Q280: Graph the function.<br>-Suppose a life insurance policy
Q281: The line graph shows the recorded hourly
Q282: For the given functions f and
Q283: Describe how the graph of the
Q285: Determine whether the three points are the
Q286: For the given functions f and
Q287: Find the average rate of change
Q288: Describe how the graph of the
Q289: Graph the function.<br>- <span class="ql-formula" data-value="f(x)=2