Multiple Choice
The line graph shows the recorded hourly temperatures in degrees Fahrenheit at an airport. 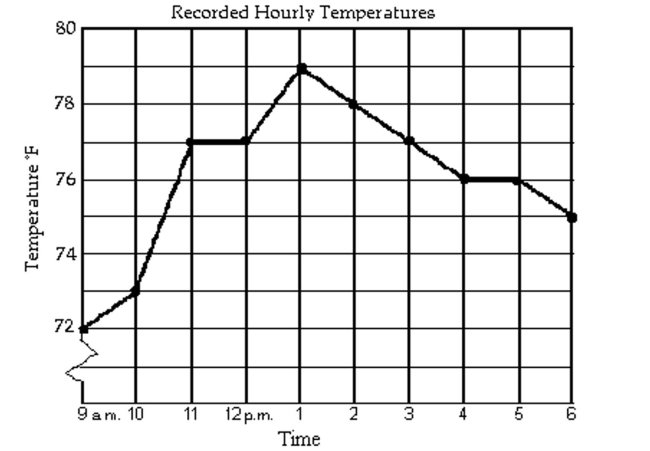
-At what times was the temperature higher than 77°F? 197)
A) from 12 p.m. until 3 p.m.
B) from 11 a.m. until 3 p.m.
C) from 12 p.m. until 1 p.m.
D) after 12 p.m.
Correct Answer:

Verified
Correct Answer:
Verified
Q156: Graph the function.<br>- <span class="ql-formula" data-value="f
Q157: Graph the function.<br>- <span class="ql-formula" data-value="f(x)=7(-x)^{3}"><span
Q158: For the points P and Q,
Q159: Graph the equation by plotting points.<br>-
Q160: Give the domain and range of
Q162: Find the center-radius form of the
Q163: Decide whether the relation defines a
Q164: Graph the function.<br>- <span class="ql-formula" data-value="f(x)=|x|-3"><span
Q165: Find the center-radius form of the
Q166: Find the requested value.<br>- <span class="ql-formula"