Multiple Choice
Graph the equation by plotting points.
- 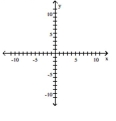
A) 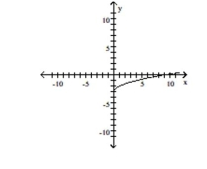
B) 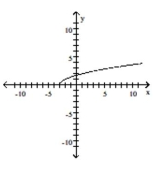
C) 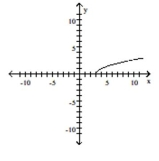
D) 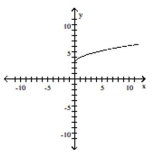
Correct Answer:

Verified
Correct Answer:
Verified
Related Questions
Q154: Find the average rate of change illustrated
Q155: Consider the function h as defined.
Q156: Graph the function.<br>- <span class="ql-formula" data-value="f
Q157: Graph the function.<br>- <span class="ql-formula" data-value="f(x)=7(-x)^{3}"><span
Q158: For the points P and Q,
Q160: Give the domain and range of
Q161: The line graph shows the recorded hourly
Q162: Find the center-radius form of the
Q163: Decide whether the relation defines a
Q164: Graph the function.<br>- <span class="ql-formula" data-value="f(x)=|x|-3"><span