Multiple Choice
The line graph shows the recorded hourly temperatures in degrees Fahrenheit at an airport. 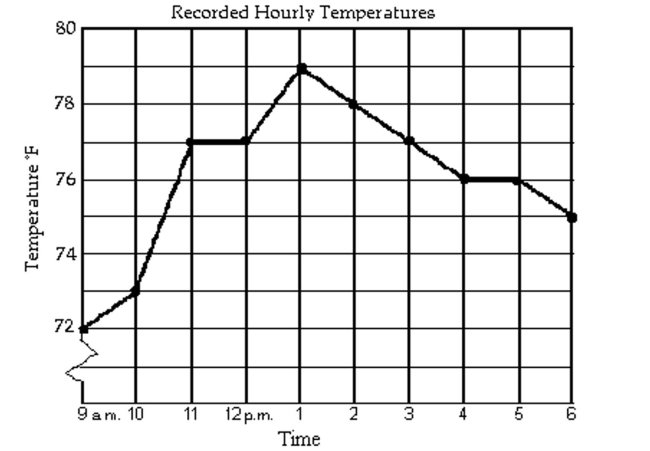
-At what times was the temperature below 77°F?
A) from 9 a.m. until 11 a.m. and from 3 p.m. until 6 p.m.
B) from 12 p.m. until 3 p.m
C) from 9 a.m. until 12 p.m. and from 3 p.m. until 6 p.m.
D) after 3 p.m.
Correct Answer:

Verified
Correct Answer:
Verified
Related Questions
Q311: Give the domain and range of
Q312: The graph of a linear function
Q313: Describe how the graph of the
Q314: Describe how the graph of the
Q315: Rewrite the equation so that one
Q317: Rewrite the equation so that one
Q318: Determine the intervals of the domain
Q319: The figure below shows the graph
Q320: Decide whether the relation defines a
Q321: Decide whether or not the equation