Multiple Choice
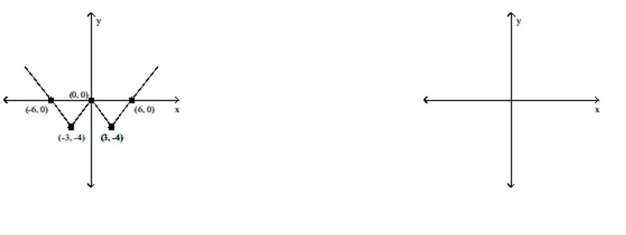
The figure below shows the graph of a function y = f(x) . Use this graph to
- 
A) 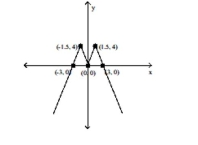
B) 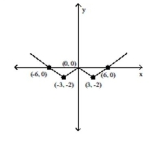
C) 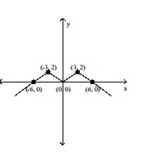
D) 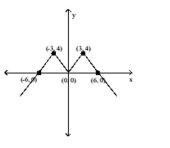
Correct Answer:

Verified
Correct Answer:
Verified
Related Questions
Q314: Describe how the graph of the
Q315: Rewrite the equation so that one
Q316: The line graph shows the recorded hourly
Q317: Rewrite the equation so that one
Q318: Determine the intervals of the domain
Q320: Decide whether the relation defines a
Q321: Decide whether or not the equation
Q322: Give the domain and range of
Q323: For the points P and Q,
Q324: Determine whether the three points are collinear.<br>-(5,