Multiple Choice
The figure below shows the graph of a function y = f(x) . Use this graph to
- 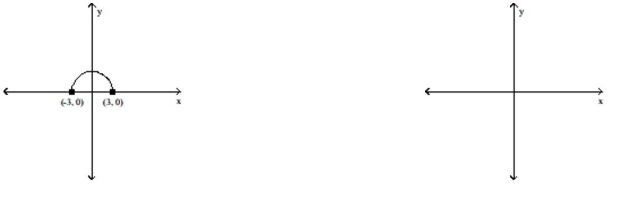
A) 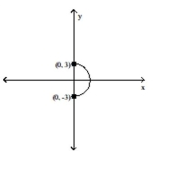
B) 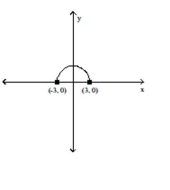
C) 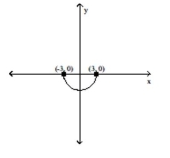
D) 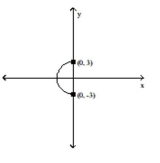
Correct Answer:

Verified
Correct Answer:
Verified
Related Questions
Q75: Write an equation for the line
Q76: Determine the intervals of the domain
Q77: Find the slope and the y-intercept
Q78: Use the graph to determine the
Q79: Describe the transformations and give the
Q81: Describe the transformations and give the
Q82: The graph of a linear function
Q83: Describe how the graph of the
Q84: The graph of a linear function
Q85: Give a rule for the piecewise-defined