Essay
(Situation E) A machine at K-Company fills boxes with bran flake cereal. The target weight for the filled boxes is 24 ounces. The company would like to use control charts to monitor the performance of the machine. The company decides to sample and weigh 10 consecutive boxes of cereal at randomly selected times over a two-week period. Twenty measurement times are selected and the following information is recorded.
-Does the following control chart represent a process that is in control or out of control? If it is out of control, explain how you arrived at this conclusion. 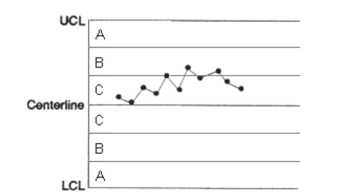
Correct Answer:

Verified
out of control; nine...View Answer
Unlock this answer now
Get Access to more Verified Answers free of charge
Correct Answer:
Verified
View Answer
Unlock this answer now
Get Access to more Verified Answers free of charge
Q33: A process is in control and has
Q34: Does the following control chart represent a
Q35: If one or more values fall outside
Q36: The variation in the output of processes
Q37: <span class="ql-formula" data-value="\text { Find the value
Q39: Control charts may only be used for
Q40: If all points fall between the control
Q41: Statistical process control consists of monitoring process
Q42: When constructing an <span class="ql-formula"
Q43: Control charts are used to help us