menu-iconExamlexExamLexServices

Discover

Ask a Question
  1. All Topics
  2. Topic
    Statistics
  3. Study Set
    Statistics for Business and Economics Study Set 4
  4. Exam
    Exam 13: Methods for Quality Improvement: Statistical Process Control Available on CD
  5. Question
    Does the Following Control Chart Represent a Process That Is
Solved

Does the Following Control Chart Represent a Process That Is

Question 34

Question 34

Short Answer

Does the following control chart represent a process that is in control or out of control? If it is out of control, explain how you arrived at this conclusion.
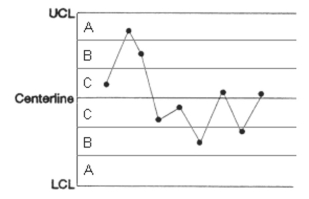
Correct Answer:

verifed

Verified

Unlock this answer now
Get Access to more Verified Answers free of charge

Related Questions

Q29: (Situation F) Ten samples of

Q30: (Situation A) To construct a p-chart

Q31: If a capability analysis study indicates that

Q32: The quality of a product is indicated

Q33: A process is in control and has

Q35: If one or more values fall outside

Q36: The variation in the output of processes

Q37: <span class="ql-formula" data-value="\text { Find the value

Q38: (Situation E) A machine at K-Company

Q39: Control charts may only be used for

Examlex

ExamLex

About UsContact UsPerks CenterHomeschoolingTest Prep

Work With Us

Campus RepresentativeInfluencers

Links

FaqPricingChrome Extension

Download The App

Get App StoreGet Google Play

Policies

Privacy PolicyTerms of ServiceHonor CodeCommunity Guidelines

Scan To Download

qr-code

Copyright © (2025) ExamLex LLC.

Privacy PolicyTerms Of ServiceHonor CodeCommunity Guidelines