Multiple Choice
The time series graph below shows annual sales figures (in thousands of dollars)
For a well known department store chain. The dominant component in these data is 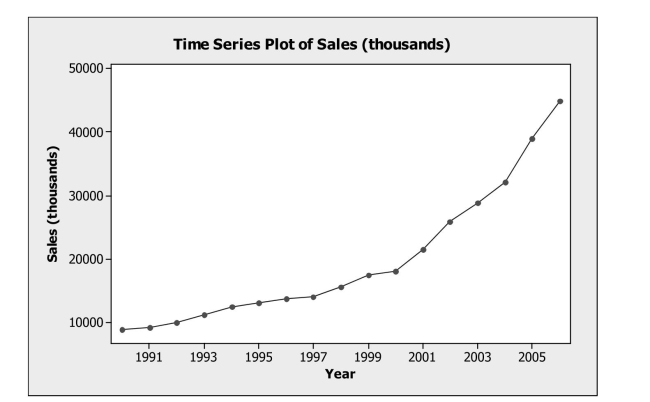
A) Trend
B) Seasonal
C) Randomness
D) Irregular
E) Error
Correct Answer:

Verified
Correct Answer:
Verified
Related Questions
Q17: Based on the actual and forecasted
Q18: Which statement about re-expressing data is not
Q19: For many countries tourism is an
Q20: The model predicted <span class="ql-formula"
Q21: A large pharmaceutical company selected a
Q23: Data were collected for a sample
Q24: A linear regression model was fit
Q25: A large pharmaceutical company selected a
Q26: A first-order autoregressive model, AR (1)
Q27: Which of the following measures is used