Multiple Choice
The time series graph below shows monthly sales figures for a specialty gift item
Sold on the Home Shopping Network (HSN) . The dominant component in these data is 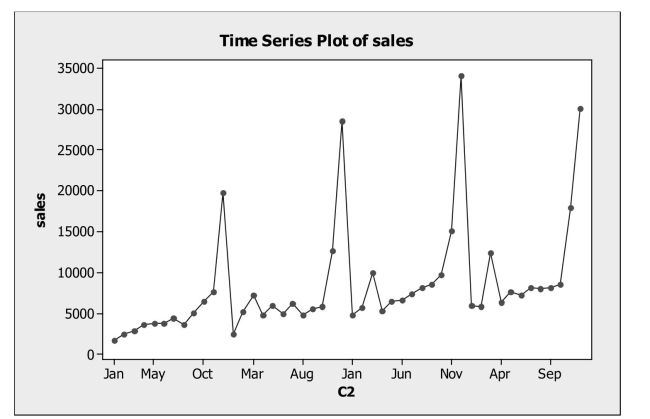
A) Cyclical
B) Seasonal
C) Randomness
D) Irregular
E) Error
Correct Answer:

Verified
Correct Answer:
Verified
Related Questions
Q4: Quarterly returns were forecasted for a mutual
Q5: The residual plot for a linear regression
Q6: In order to examine if there
Q7: Based on returns for the last
Q8: A least squares estimated regression line has
Q10: Stock prices and earnings per share
Q11: For many countries tourism is an
Q12: Data were collected for a sample
Q13: For many countries tourism is an
Q195: A farmer has increased his wheat production