Multiple Choice
The residual plot for a linear regression model is shown below. Which of the
Following statements is true? 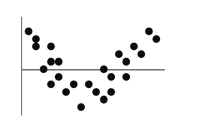
A) The linear model is okay because the same number of points is above the line as below it.
B) The linear model is okay because the association between the two variables is fairly strong.
C) The linear model is no good because the correlation is near 0.
D) The linear model is no good because some residuals are large.
E) The linear model is no good because of the curve in the residuals.
Correct Answer:

Verified
Correct Answer:
Verified
Q1: The time series graph below shows annual
Q2: Data were collected for a sample
Q3: Weekly commodity prices for heating oil
Q4: Quarterly returns were forecasted for a mutual
Q6: In order to examine if there
Q7: Based on returns for the last
Q8: A least squares estimated regression line has
Q9: The time series graph below shows monthly
Q10: Stock prices and earnings per share
Q11: For many countries tourism is an