Essay
Following is a time series graph for monthly closing price of 3M Dental Products
stock (beginning June 2005). 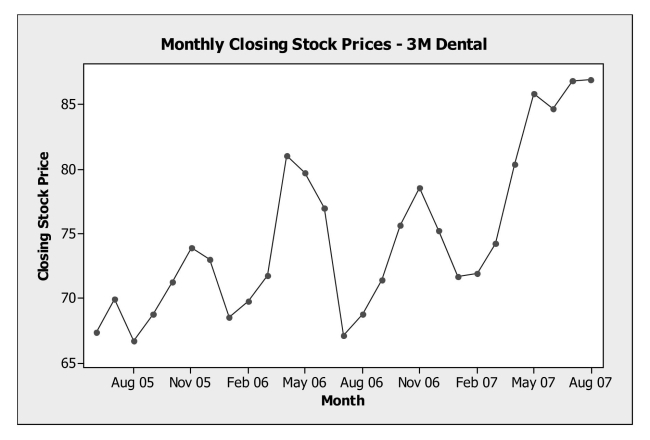
a. Are the closing prices for shares of 3M Dental Products from June 2005 through
August 2007 stationary? Explain.
b. Would a histogram provide a good summary of these stock prices? Explain.
Correct Answer:

Verified
No, an upward trend ...View Answer
Unlock this answer now
Get Access to more Verified Answers free of charge
Correct Answer:
Verified
View Answer
Unlock this answer now
Get Access to more Verified Answers free of charge
Q14: The following table shows closing share
Q15: Following is the five number summary
Q16: Interpret summary statistics.<br>-Consider the five number
Q17: Analyze scatterplots and correlation coefficients.<br>-For the data
Q18: Analyze data of quantitative variables.<br>-The following
Q19: Interpret summary statistics.<br>-Based on the five
Q21: Analyze data of quantitative variables.<br>-The following
Q22: Compare results using standardization.<br>-The following table
Q23: Describe displays of distributions.<br>-Below is a histogram
Q24: Data were collected on the hourly wage