Multiple Choice
Describe displays of distributions.
-Below is a histogram of salaries (in $) for a sample of U.S. marketing managers. The
Most appropriate measure of central tendency for these data is the 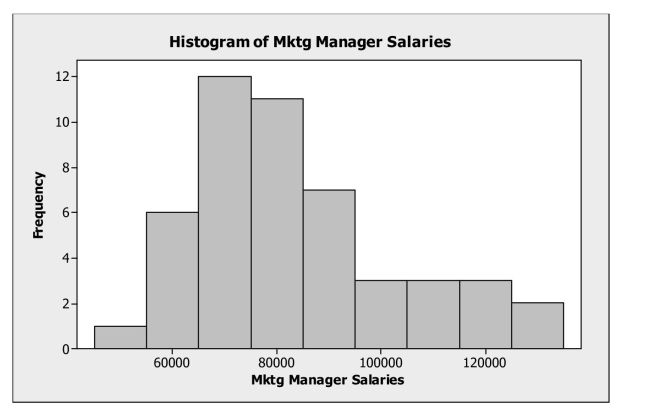
A) median.
B) mean.
C) mode.
D) range.
E) standard deviation.
Correct Answer:

Verified
Correct Answer:
Verified
Q14: The following table shows closing share
Q15: Following is the five number summary
Q16: Interpret summary statistics.<br>-Consider the five number
Q17: Analyze scatterplots and correlation coefficients.<br>-For the data
Q18: Analyze data of quantitative variables.<br>-The following
Q19: Interpret summary statistics.<br>-Based on the five
Q20: Following is a time series graph for
Q21: Analyze data of quantitative variables.<br>-The following
Q22: Compare results using standardization.<br>-The following table
Q24: Data were collected on the hourly wage