Multiple Choice
Determine if a display of data is appropriate.
-The pie chart below for data collected about clients of brokerage firm shows 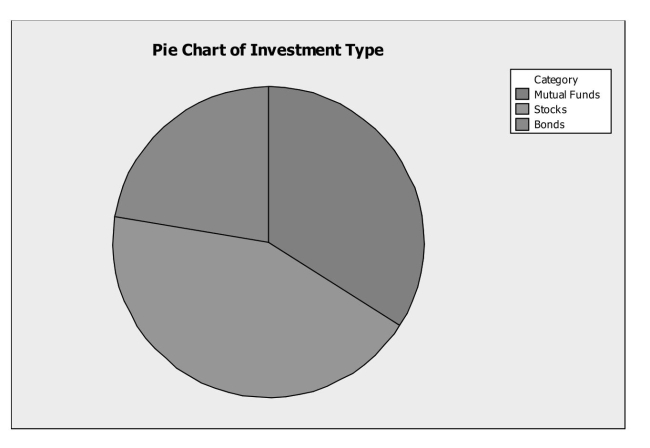
A) the distribution of a quantitative variable.
B) the contingency distribution of investment type.
C) the conditional distribution of investment type.
D) the marginal distribution of investment type.
E) the joint distribution of investment type.
Correct Answer:

Verified
Correct Answer:
Verified
Q3: Determine if a display of data is
Q4: Determine if a display of data is
Q5: Find conditional and marginal distributions.<br>-A regional
Q6: Find conditional and marginal distributions.<br>-A full
Q7: Find conditional and marginal distributions.<br>-A large
Q8: Interpret summary statistics.<br>-Find each of the following
Q9: Find conditional and marginal distributions.<br>-A full
Q10: Examine a contingency table.<br>-A full service
Q11: Examine a contingency table.<br>-A regional survey
Q23: A research company frequently monitors trends