True/False
SCENARIO 17-8
The superintendent of a school district wanted to predict the percentage of students passing a sixth-
grade proficiency test. She obtained the data on percentage of students passing the proficiency test
(% Passing), daily mean of the percentage of students attending class (% Attendance), mean teacher
salary in dollars (Salaries), and instructional spending per pupil in dollars (Spending) of 47 schools in
the state. Following is the multiple regression output with Passing as the dependent variable, Attendance, Salaries and Spending:
ANOVA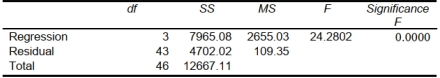
-Referring to Scenario 17-8, the null hypothesis implies that percentage
of students passing the proficiency test is not affected by any of the explanatory variables.
Correct Answer:

Verified
Correct Answer:
Verified
Q1: SCENARIO 17-1<br>A real estate builder wishes
Q3: SCENARIO 17-8<br>The superintendent of a school
Q5: SCENARIO 17-1<br>A real estate builder wishes
Q6: SCENARIO 17-12<br>The marketing manager for a nationally
Q7: SCENARIO 17-1<br>A real estate builder wishes
Q8: The director of admissions at a
Q9: SCENARIO 17-5<br>You worked as an intern
Q10: SCENARIO 17-8<br>The superintendent of a school
Q11: SCENARIO 17-10 Given below are results
Q60: Double-clicking a cell in a PivotTable causes