Multiple Choice
260 randomly sampled college students were asked, among other things, to state their year in school (freshman, sophomore, junior, or senior) . The responses are shown in the bar graph below. How many of the students who responded would be classified as upperclassmen (e.g., juniors or seniors) ? 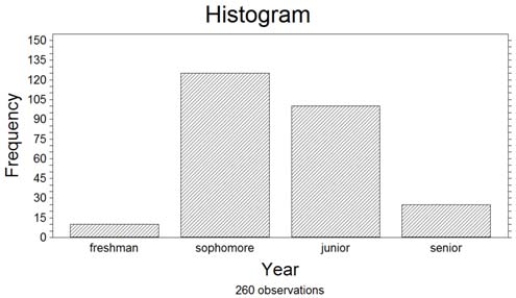
A) Approximately 100
B) Approximately 125
C) Approximately 10
D) Approximately 25
Correct Answer:

Verified
Correct Answer:
Verified
Q21: All class intervals in a histogram have
Q86: Given the sample variance of a distribution,
Q131: The following data represent the scores
Q132: If nothing is known about the shape
Q133: Which of the following statements could be
Q134: <img src="https://d2lvgg3v3hfg70.cloudfront.net/TB4890/.jpg" alt=" The bar graph
Q136: The amount spent on textbooks for the
Q139: At the U.S. Open Tennis Championship a
Q140: Which of the following statements concerning the
Q166: The range is an insensitive measure of