Multiple Choice
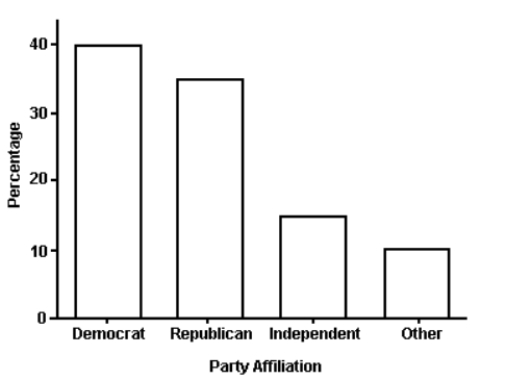 The bar graph shows the political affiliation of 1000 registered U.S. voters. What percentage of the voters belonged to one of the traditional two parties (Democratic or Republican) ?
A) 75%
B) 40%
C) 35%
D) 25%
Correct Answer:

Verified
Correct Answer:
Verified
Related Questions
Q21: All class intervals in a histogram have
Q86: Given the sample variance of a distribution,
Q129: Various state and national automobile associations regularly
Q131: The following data represent the scores
Q132: If nothing is known about the shape
Q133: Which of the following statements could be
Q135: 260 randomly sampled college students were asked,
Q136: The amount spent on textbooks for the
Q139: At the U.S. Open Tennis Championship a
Q166: The range is an insensitive measure of