Multiple Choice
One of the questions posed to a sample of 286 incoming freshmen at a large public university was, "Do you have any tattoos?" Their responses are shown below in the pie chart. Please note that the values shown represent the number of responses in each category. 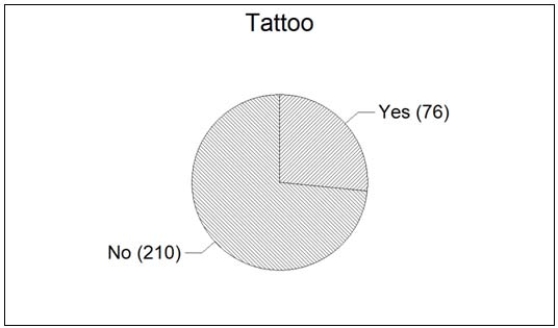 Based on the responses shown in the pie chart, what percentage of the freshmen responded with "Yes?"
A) 76
B) 76%
C) 26.6%
D) 73.4%
Correct Answer:

Verified
Correct Answer:
Verified
Q16: The bars in a bar graph can
Q16: Parking at a university has become a
Q18: Calculate the mean of a sample
Q20: What number is missing from the
Q20: A frequency table displays the proportion of
Q22: The distribution of salaries of professional basketball
Q25: The output below displays the mean
Q26: The box plot shown below was constructed
Q31: A sample of 100 e-mail users were
Q55: A Pareto diagram is a pie chart