Multiple Choice
The box plot shown below was constructed for the amount of soda that was poured by a filling machine into 12-ounce soda cans at a local soda bottling company. 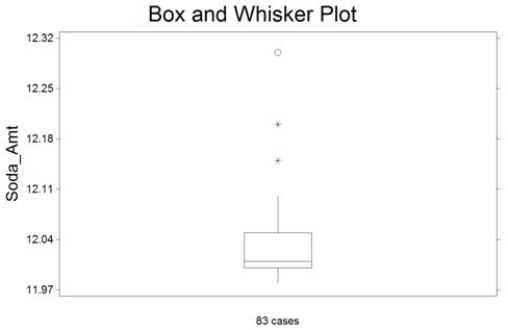 We see that one soda can received 12.15 ounces of soda on the plot above. Based on the box plot presented, how would you classify this observation?
A) expected observation
B) suspect outlier
C) highly suspect outlier
D) it has a lot of soda
Correct Answer:

Verified
Correct Answer:
Verified
Q21: One of the questions posed to a
Q22: The distribution of salaries of professional basketball
Q25: The output below displays the mean
Q27: The payroll amounts for all teams in
Q29: When Scholastic Achievement Test scores (SATs) are
Q30: At the U.S. Open Tennis Championship a
Q31: A sample of 100 e-mail users were
Q34: Suppose that 50 and 75 are two
Q55: A Pareto diagram is a pie chart
Q66: A retail storeʹs customer satisfaction rating is